Check out the projects I have been working on!
All my code is on GitHub here: github.com/PhilParisi
All my code is on GitHub here: github.com/PhilParisi
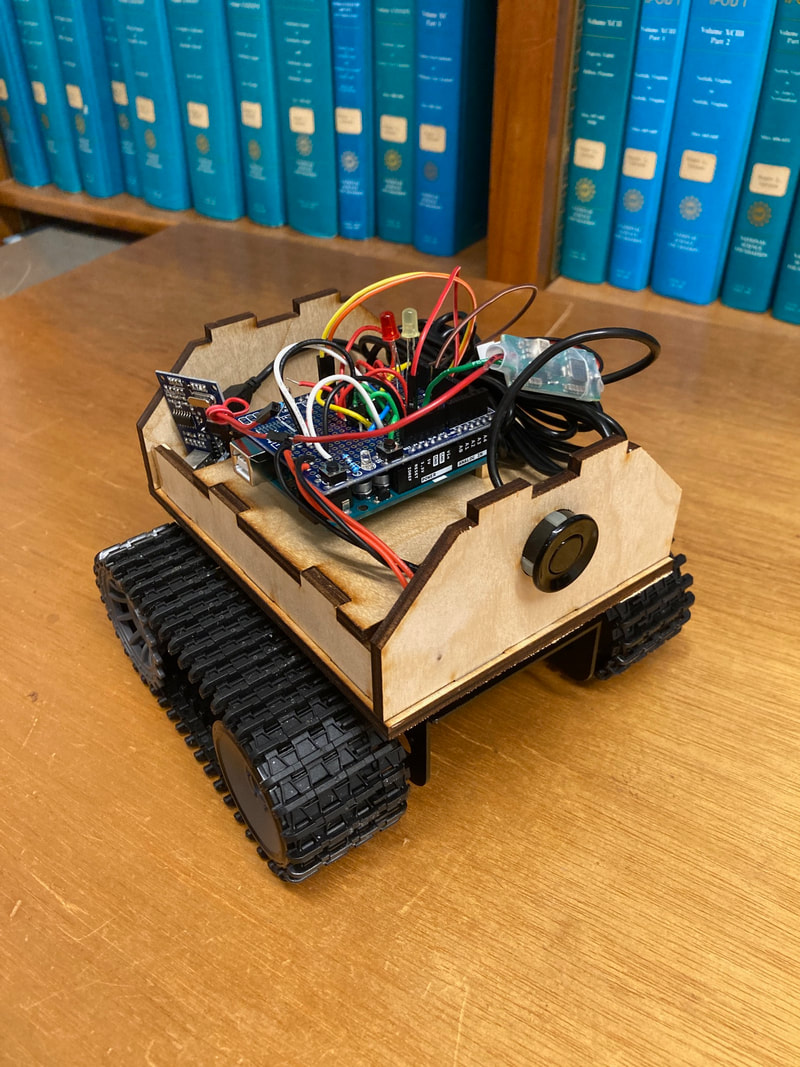
Tethered, Manually-Commanded, Object-Avoiding Robot Jason Noel and I partnered to design, fabricate, and program a robot as a final project to our Mechatronics class.
The robot is based around an Arduino with serial communication to a Python GUI. The system requires a minimum of 5V input (from an external battery). Two motors are actuated using an H-bridge, which rotate the 'tank chains' on either side. The vehicle can move forward and reverse, as well as turn left and right. In the event that objects are encountered, the forward-looking ultrasonic sensor will detect it and automatically stop the vehicle. It is up to the user to then 'free' the robot from the situation. |
|
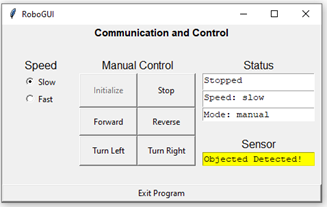
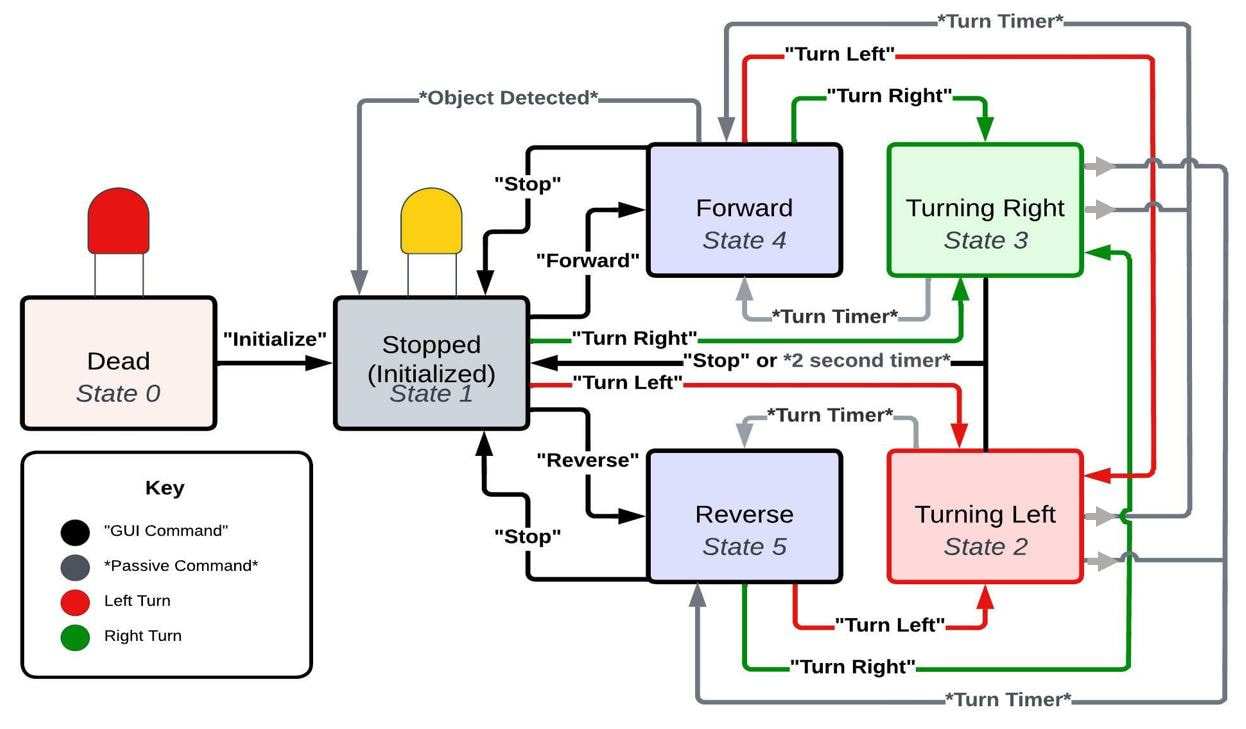
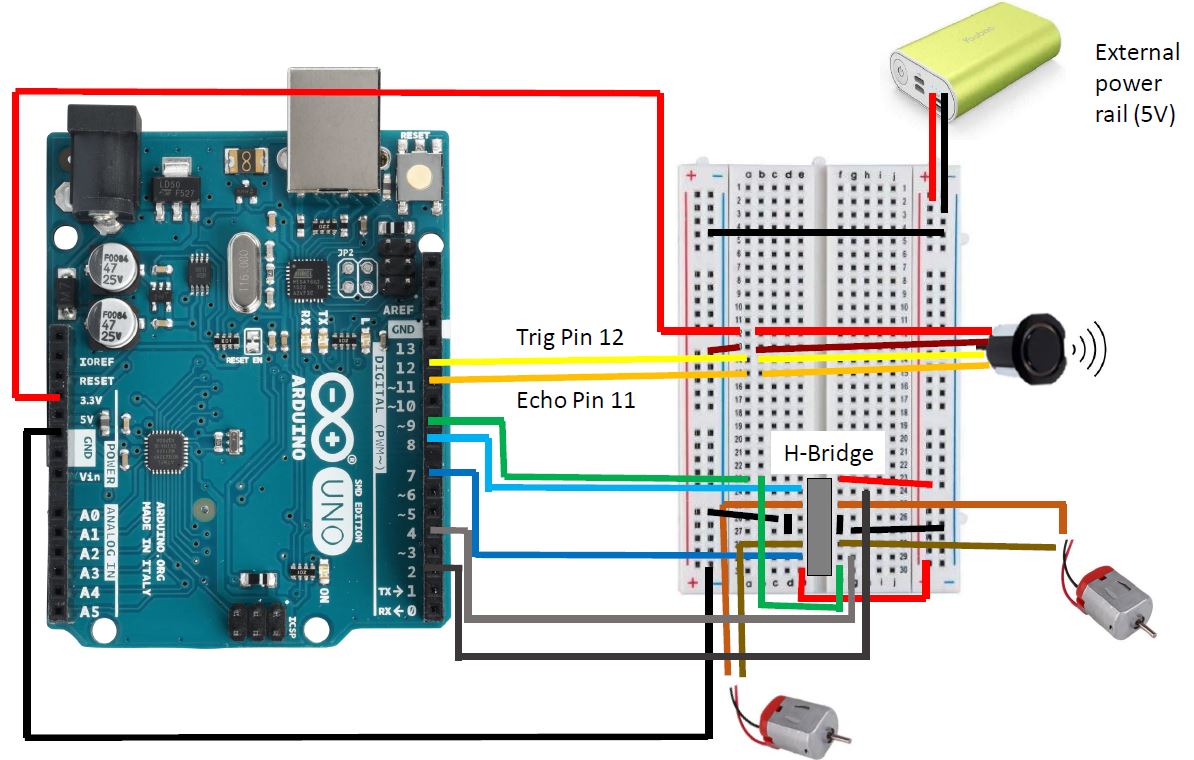
An image of the Communication and Control RoboGUI is above. The GUI was made using the tkinter Python package. Each 'click' in the GUI triggers a unique command to be sent via USB cable (not shown in robot image) to the Arduino. The Arduino program then uses that command to determine which state to move to next based upon the State Transition Diagram (below right image). Timers were used (rather than encoders) to turn for simplicity. A full wiring diagram explains the major components (bottom right) and all code used be found on my GitHub.
|
|
MS Thesis: Furthering Usability and Efficiency of Gaussian Process Regression as Applied to Seafloor Mapping
|
Check out the Poster!
@University of Rhode Island - Coastal Institute - Dec '22 |
| ||
Gaussian Process Regression (GPR) is a machine learning algorithm that can be applied to seafloor bathymetry (mapping). In doing so, one can generate both predictions of seafloor depth as well as associated uncertainty values. These uncertainties provide crucial knowledge to inform a plethora of other robotic algorithms for autonomous vehicles. GPR, however, becomes intractable for large datasets and cannot be computed efficiently (preventing real-time operations). Previous work has pushed the data memory/storage capabilities by utilizing GPUs and CUDA code. A complementary approach involves down-sampling a large datasets to a smaller, representative group of points (approximate methods). This approach offers the benefit of reducing computation requirements (due to less points to train on) while maintaining high accuracy with respect to GPR using the entire dataset. Basically, the current algorithm is slow. Can we speed it up while maintaining high accuracy?
Enough chat. Let's look at some scholarly graphs:
Enough chat. Let's look at some scholarly graphs:
|
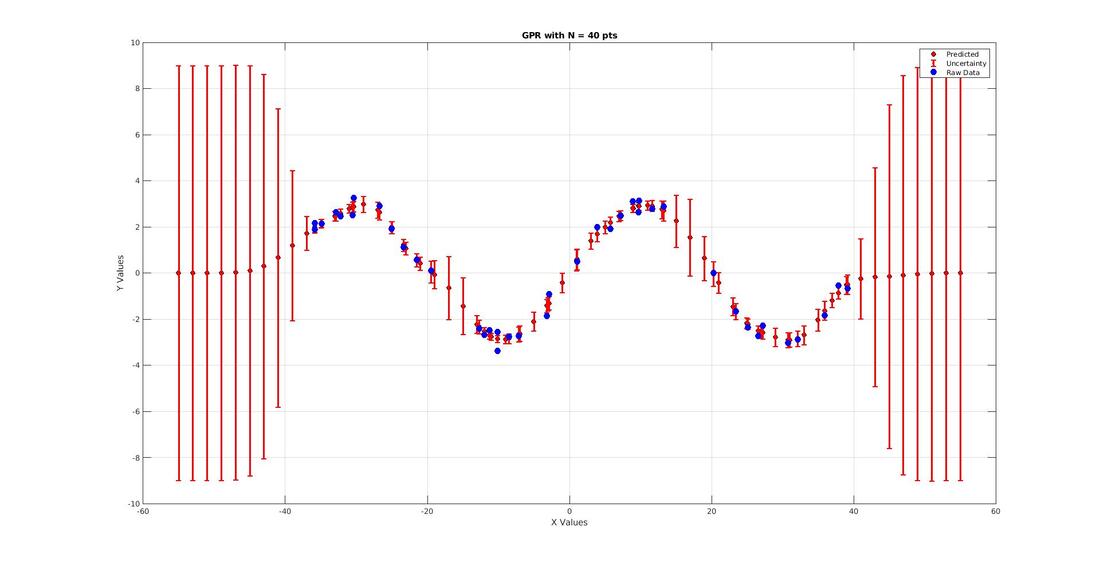
This graph depicts standard 2-dimensional GPR. The blue points represent 40 raw data points. X values are inputs and Y values are outputs. The blue points are used to train the GPR model.
Then, the red points are where predictions are made. There are more prediction points than raw data. Notice where there is a lack of raw data, the prediction uncertainties (error bars) grows. These error bars make GPR unique. Other regression methods, like polynomial fits or interpolation, do not have uncertainties. |
|
|
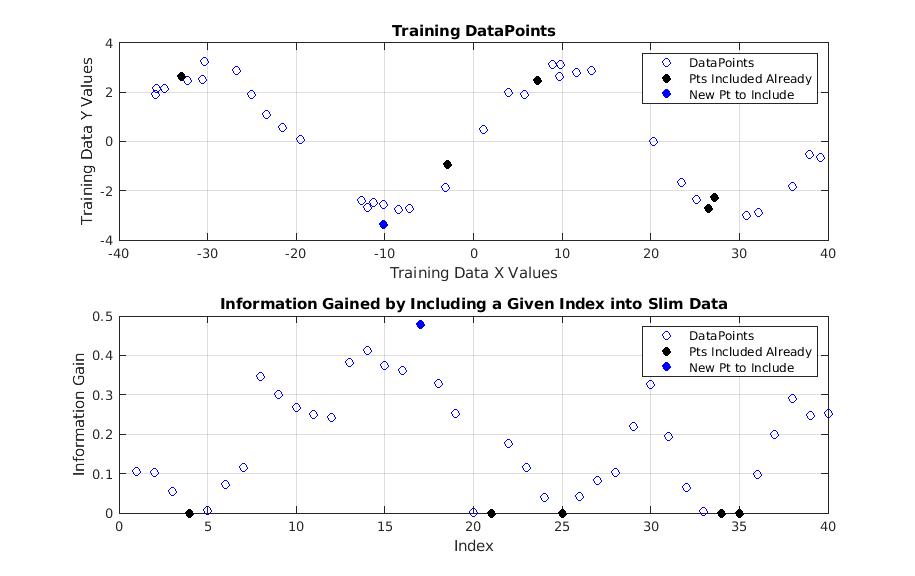
GPR becomes intractable with large datasets. Hence, approximate methods are used to downsample the raw data into fewer points. On the left, we see black clear points (raw data), in the process of being downsampled into solid black points (current slim dataset). With 5 points in our slim data, this begs the question, "what would be the next informative datapoint to include?"
The blue datapoint is the next recommended datapoint! This value has the maximum 'information gain' (bottom figure). Information gain comes from previous work in the Power Propagation method. When done iteratively, this method selects a slim dataset from a raw dataset while calculating a GPR model for predictions and uncertainties. |
|
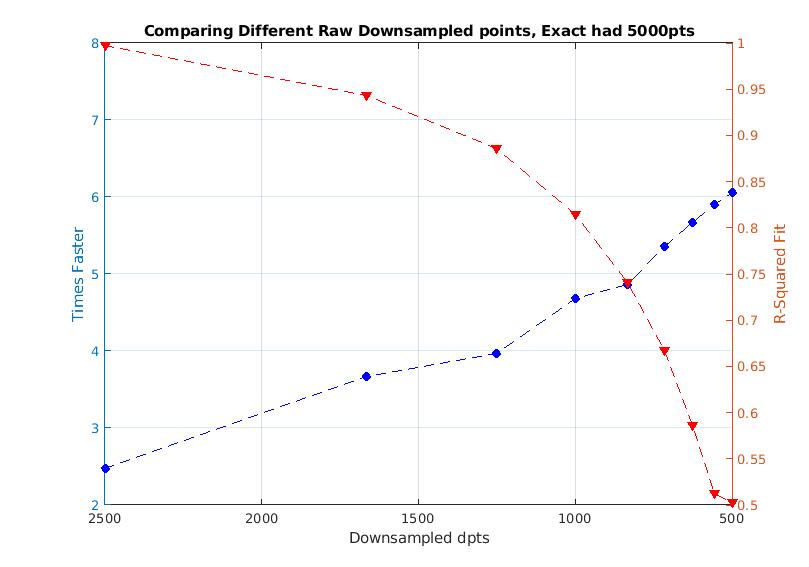
The reason we care about any of this, is because GPR is extremely slow with large datasets. Hence, it's important to observe certain metrics when we speed up the algorithm.
Because we downsample from our raw data, we lose information and also lose our accuracy. But, we also speed up the algorithm substantially. The graph on the right shows speed-up (times faster) on the left axis and blue datapoints. The right orange/red points and axis depicts the R-squared fit from the slim GPR to the full GPR with all raw data. The raw dataset has 5000pts. The x-axis shows the number of points used in the slim dataset. Note this graph used pure decimation (selecting every 4th, 5th, 6th, etc. datapoint) and not the above Power Propagation algorithm. The ideal algorithm maximizes the speed up while keeping the R-squared fit high. |
|
Underwater Habitat Classification
Image processing project to determine percent habitat coverage from raw images. We determined three major habitats --> sand (white), seagrass (black), and mixed (gray).
|
The following operations were performed:
1. convert to grayscale 2. homomorphic filter (even out lighting) 3. multiple thresholds 4. morphologic operations (open and close) 5. count pixels After analyzing hundreds of photos: 21.6% sand, 32.2% seagrass, 46.2% mixed LINK TO GITHUB REPO |
RAW IMAGE EDITED IMAGE

|
Robotic Simulations - Fun with ROS
ROS [Robotic Operating System] is a versatile, modular platform that runs on Linux and stands as the dominant programming architecture for robotics today.
Left: TurtleBot3 generates a 2D map using a LiDAR sensor while being remotely controlled. This is SLAM, simultaneous localization and mapping.
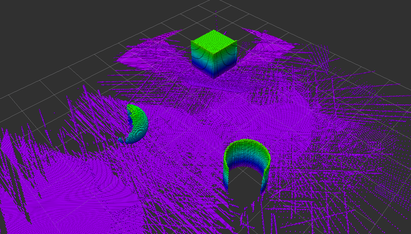
Center: image of a 3D LiDAR occupancy map (called an 'octomap') made with the Iris Drone.
Right: TurtleBot3 autonomously navigates the LiDAR map from it's current pose to a goal destination. It even avoids a newly introduced obstacle.
Left: TurtleBot3 generates a 2D map using a LiDAR sensor while being remotely controlled. This is SLAM, simultaneous localization and mapping.
Center: image of a 3D LiDAR occupancy map (called an 'octomap') made with the Iris Drone.
Right: TurtleBot3 autonomously navigates the LiDAR map from it's current pose to a goal destination. It even avoids a newly introduced obstacle.
|
|
|
|
Europe & USA Size Comparison - Independent Collaboration // Jan 2019
|
|
Link to 'Euro US Comparison' Shiny App
Motivation A German and an American walk into a bar... and have no clue which US State was the size of Germany. We built a tool that compares the size of US States to European countries. Turns out, Montana and Germany are similar! Use the dropdowns on the left. Execution - Downloaded, scraped Wiki pages and created dataset .txt files using Bash ::H.Holze - Imported .txt files, built interactive web application using ShinyR in R-Studio ::P.Parisi Then embedded code into website with R Markdown code <iframe width="1000" height="750" scrolling="no" frameborder="yes" src="https://pancake.shinyapps.io/Euro_US_Comparison/"> </iframe> |
Spatial Data Analytics Seminar - Marquette University // Jan 2020
|
Map of Crime Downtown Milwaukee
Legend: Purple = vehicle break-in, Blue = burglary, Green = shooting Data source: https://data.milwaukee.gov/ (2018-2019) Program: Tableau 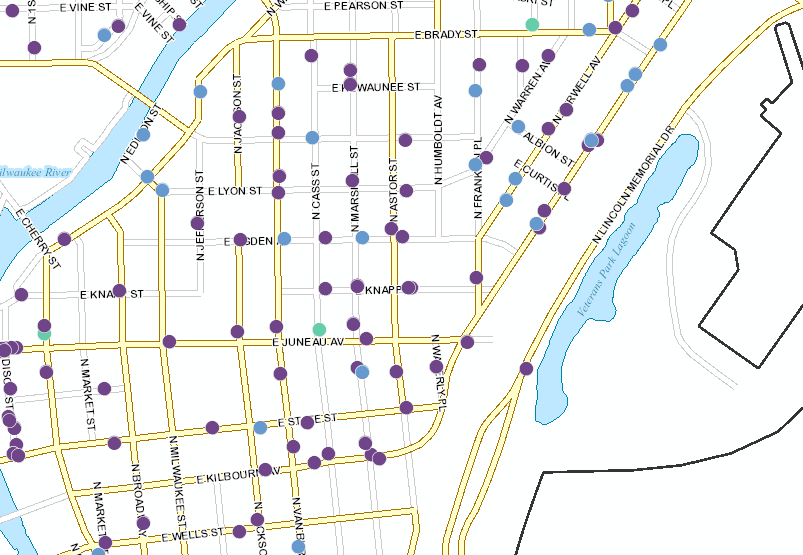
|
Map of Logan River Watershed, Utah
Legend: Yellow/Blue = mountain slope, Black/White = sub watersheds, Purple Triangle = water flow outlet analyzed Data source & Program: ArcGIS 
|
Useful Links to Data Sources, Maps, Programs, and E-Learning
https://www.w3schools.com/sql/sql_select.asp - learn SQL and basics of many programming languages https://postgis.net/ - PostgreSQL extension geared for location queries https://mke-evict.com/sda/ - project map that tracks all the evictions across Milwaukee https://www.openstreetmap.org/#map=5/38.007/-95.844 - opensource map exports of your choice https://refloh2o.com/milwaukee-community-map - map of Milwaukee sharing stories and history https://skyvector.com/ - live maps of free and blocked airspace https://www.arcgis.com/home/index.html - popular spatial data software with desktop and online versions https://factfinder.census.gov/faces/nav/jsf/pages/index.xhtml - open source US Census sortable data https://data.milwaukee.gov/ - open source Milwaukee data http://geoservices.tamu.edu/Services/Geocode/BatchProcess/ - geocoding service to coordinates to maps |
Industrial Automation Demonstration - Senior Design // Fall 2018 thru Spring 2019
|
|
Overview
- Design and build an Industrial Automation Demonstration using collaborative robot, Sawyer from Rethink Robotics, for Marquette University's Flexible Assembly Systems Network Laboratory. - Five-member team created fully automated system that disassembles a flashlight, performs a four-part assembly, checks light functionality (quality control), and custom engraves the body with a visitor's name (see video, left). Project Contributions - Co-developed system logic, progression of robot through tasks and items required to support demonstration - Safety system with two zone protection using Keyence LiDAR safety laser scanner and alarm to protect human visitors - Calibrated and tested BossLaser LS-1416 engravement on anodized aluminum flashlight bodies - Python code to automatically generate engravement file from user text input, start robot program, prompt light check, fire laser engraver, and reset system to loop/repeat for next demo (code used and tutorial at bottom of page) |
Finite Element Project, Independent Study // Spring 2019
Program Finite Element Method (FEM) into MATLAB.

Develop shape functions using Lagrangian polynomials.
|
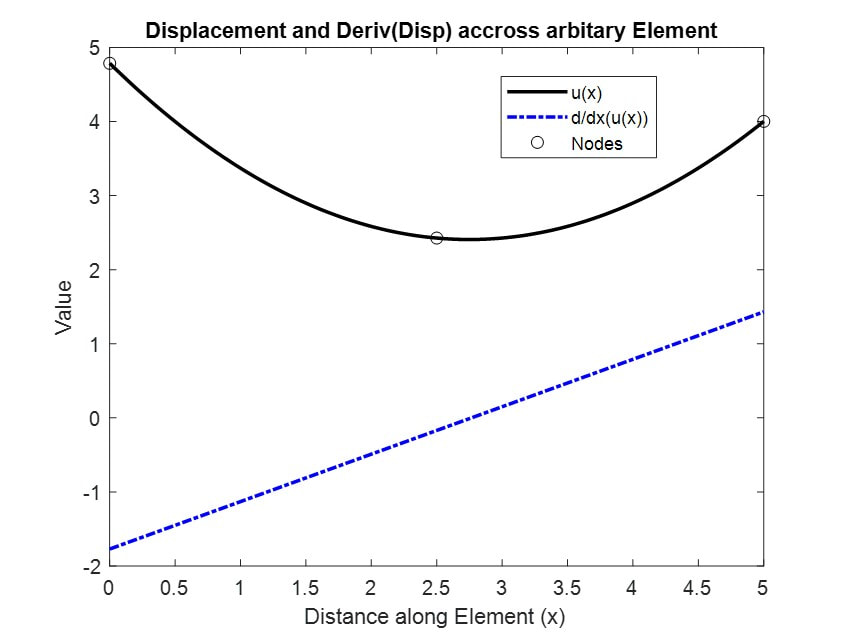
Use shape functions and nodal displacements to calculate displacements and derivative of displacements (strain).
|
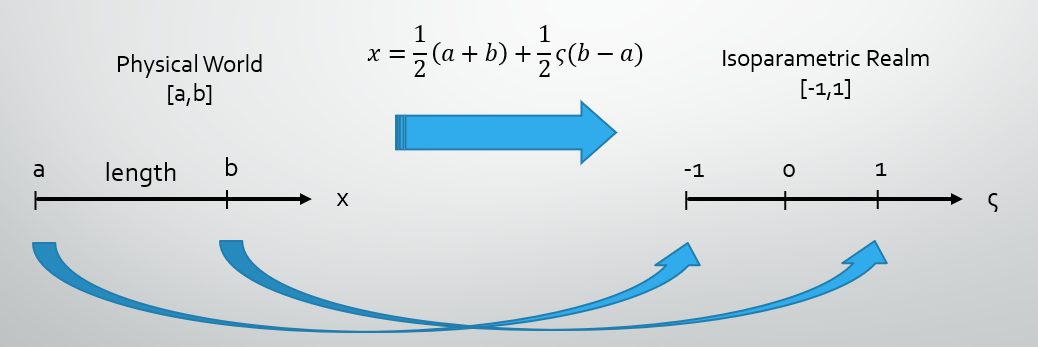
Convert displacements of a,b to isoparametric realm of -1,1 enable Gaussian Quadrature (thus avoiding the closed form weak integral), now can calculate stiffness matrix and stresses - the goal of FEM.
|
Manufacturing Projects // Spring 2019
Design a 3D-printable Rook and Pawn chess piece (creativity encouraged). CAD models on left, 3D printed parts on right.

|

|

|

|
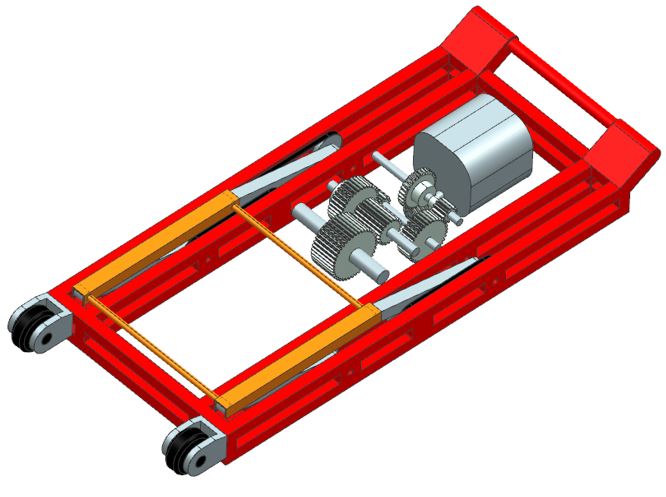
Motorcycle Lift - Design of Machine Elements Project // Spring 2018
Design a mechanical system driven by a motor. Team designed 1,000 lb. motorcycle lift.
Input Motor: 18.54 lbf and 850 RPM. Gear Ratio: 540:1. Output Shaft: 10,000 lbf and 1.42 RPM
Input Motor: 18.54 lbf and 850 RPM. Gear Ratio: 540:1. Output Shaft: 10,000 lbf and 1.42 RPM

|
|

|
Oxygen Tank Carrying Case, FlowAdjust - Mobile Oxygen Solutions (The Commons) // Fall 2017

|
BreatheBuddy
LEFT. Team Mobile Oxygen Solutions in The Commons class of 2017. Designed BreatheBuddy rolling case to aesthetically house oxygen tanks for seniors on the move. Model depicts initial ideation and fitting of common oxygen tank sizes. Team also composed a grant for the IPF Catalyst Challenge. FlowAdjust BELOW. Side project to improve oxygen flow adjustment. In-line oxygen tube fitting allows user to change flowrate from within hands reach rather than using metal tank adjustment valve.
|


Edible Dry Mouth Solution - AquaDrop LLC (student startup) // Spring thru Fall 2017
January 2017 Direct Supply Student Hackathon Challenge: Take the cost out of senior healthcare.
Solution: Reduce occurrence of cavities and dental extraction caused by Xerostomia (dry mouth) through use of an edible gummy to lubricate the mouth and prevent decay.
Team placed 1st in competition, founded company, secured further funding from Brewed Ideas Challenge, sought Intellectual Property. Company folds in October 2017.

CAD model of gelatin exterior, filled with artificial saliva. 10mm diameter.
|

3D printed model to test feel, size, and consumer response.
|

Prototyping using gelatin base and artificial saliva (see spheres resting on top of base)
|

Finished, edible prototypes used for initial testing
|
